Showing posts with label unitedstates. Show all posts

Friday, February 28, 2025

US Combined Soccer Leagues 2025

UPDATED November 30, 2025: Final Standings below.

Just suppose that many years ago, the US Soccer Federation required all professional teams to play in the same league system. Just suppose that they decided to divide teams vertically into Division 1, Division 2, etc. Just suppose that, each year, they promoted the best teams from Division 2 and relegated the worst teams from Division 1.

And here's the big leap. Just suppose that we didn't have any more teams playing than what we actually have.

In 2025, the USSF has 97 professional men's teams. After the 2024 season, Memphis 901, Northern Colorado Hailstorm, Los Angeles Force, Maryland Bobcats, Michigan Stars, Arizona Monsoon, Capo, Central Valley Fuego, Irvine Zeta, Georgia FC, Lyon and Savannah Clovers folded. Some of these teams said they would play this year, but they did not release a schedule by the end of February, so we are proceeding without them. New teams added to Division 4 are San Diego, AV ALTA, Naples, Portland Hearts of Pine, Texoma and Westchester.

Here is a map of the teams. Click the rectangle tab thing in the upper left to get to the list where you can deselect the separate divisions.

Here are the final standings:

Since a wonderful home-and-away round robin didn't actually happen in each league above, I substituted that with ranking the teams by points-per-game, including each team's league and cup games played in 2024, only counting games against teams in its division (Division 1, 2, 3 or 4).

Three teams will be relegated from Division 1 and three teams promoted from Division 2. Four teams will be relegated from Division 2, while the best two of each Division 3 league will be promoted. The number of teams moving between Divisions 3 and 4 is determined by the total number of teams in 2026. At least one team will be relegated from each Division 3 league.

B teams must be in a division below their A teams (unless both are in Division 4), so if an A team is relegated from Division 1 to Division 2, then the B team will be relegated from Division 2 to Division 3, no matter its place in the table.

Friday, February 16, 2024

US Combined Soccer Leagues 2024

UPDATED February 28, 2024: Final Standings are below.

Just suppose that many years ago, the US Soccer Federation required all professional teams to play in the same league system. Just suppose that they decided to divide teams vertically into Division 1, Division 2, etc. Just suppose that, each year, they promoted the best teams from Division 2 and relegated the worst teams from Division 1.

And here's the big leap. Just suppose that we didn't have any more teams playing than what we actually have.

In 2024, the USSF has 103 professional men's teams. After the 2023 season, Rio Grande Valley, San Diego Loyal, Albion San Diego, City Union and Gold Star Detroit folded. New teams added to Division 4 are Rhode Island, Spokane Velocity, Arizona Monsoon, Capo, Georgia Lions, Irvine Zeta and Carolina Core.

Here is a map of the teams. Click the rectangle tab thing in the upper left to get to the list where you can deselect the separate divisions.

Here are the final standings:

Since a wonderful home-and-away round robin won't actually happen in each league above, I will substitute that with ranking the teams by points-per-game, including each team's league and cup games played in 2024, only counting games against teams in its division (Division 1, 2, 3 or 4).

Three teams will be relegated from Division 1 and three teams promoted from Division 2. Four teams will be relegated from Division 2, while the best two of each Division 3 league will be promoted. The number of teams moving between Divisions 3 and 4 is determined by the total number of teams in 2025. At least one team will be relegated from each Division 3 league.

B teams must be in a division below their A teams (unless both are in Division 4), so if an A team is relegated from Division 1 to Division 2, then the B team will be relegated from Division 2 to Division 3, no matter its place in the table.

Saturday, February 04, 2023

US Combined Soccer Leagues 2023

UPDATED February 16, 2024: Final Standings below.

Just suppose that many years ago, the US Soccer Federation required all professional teams to play in the same league system. Just suppose that they decided to divide teams vertically into Division 1, Division 2, etc. Just suppose that, each year, they promoted the best teams from Division 2 and relegated the worst teams from Division 1.

And here's the big leap. Just suppose that we didn't have any more teams playing than what we actually have.

In 2023, the USSF has 101 professional men's teams. After (or during) the 2022 season, California United Strikers, Tucson, Bay Cities, Valley United, and Syracuse Pulse folded. New teams added to Division 4 are Lexington Sporting, One Knox, Club de Lyon, Gold Star Detroit, Savannah Clovers, Austin II, Crown Legacy, Huntsville City, and Los Angeles F.C. 2. St. Louis City is added to Division 3, taking the place of St. Louis City2, which will be in Division 4.

Here is a map of the teams. Click the rectangle tab thing in the upper left to get to the list where you can deselect the separate divisions.

Here are the final standings:

Since a wonderful home-and-away round robin didn't actually happen in each league above, I substituted that with ranking the teams by points-per-game, including each team's league and cup games played in 2023, only counting games against teams in its division (Division 1, 2, 3 or 4).

Three teams are relegated from Division 1 and three teams promoted from Division 2. Four teams are relegated from Division 2, while the best two of each Division 3 league are promoted. The number of teams moving between Divisions 3 and 4 is determined by the total number of teams in 2024. At least one team is relegated from each Division 3 league.

B teams must be in a division below their A teams (unless both are in Division 4), so if an A team is relegated from Division 1 to Division 2, then the B team is relegated from Division 2 to Division 3, no matter its place in the table.

Sunday, January 02, 2022

US Combined Soccer Leagues 2022

UPDATED March 13, 2023: Final Standings below, updated based on teams in 2023.

Just suppose that many years ago, the US Soccer Federation required all professional teams to play in the same league system. Just suppose that they decided to divide teams vertically into Division 1, Division 2, etc. Just suppose that, each year, they promoted the best teams from Division 2 and relegated the worst teams from Division 1.

And here's the big leap. Just suppose that we didn't have any more teams playing than what we actually have.

In 2022, the USSF has 97 professional men's teams. After the 2021 season, Austin Bold, New Amsterdam, and OKC Energy folded. New teams added to Division 4 are Charlotte FC, Monterey Bay, Central Valley Fuego, Northern Colorado Hailstorm, Bay Cities, Flower City Union, Syracuse Pulse, Valley United, Rochester New York, St. Louis City, and the B teams for Chicago Fire, Cincinnati, Colorado Rapids, Columbus Crew, Houston Dynamo, Minnesota United, New York City, Orlando City, Philadelphia Union, Portland Timbers, San Jose Earthquakes, and Vancouver Whitecaps.

Here is a map of the teams. Click the rectangle tab thing in the upper left to get to the list where you can deselect the separate divisions.

Here are the final standings:

Since a wonderful home-and-away round robin didn't actually happen in each league above, I substituted that with ranking the teams by points-per-game, including each team's league and cup games played in 2022, only counting games against teams in its division (Division 1, 2, 3 or 4).

Three teams will be relegated from Division 1 and three teams promoted from Division 2. Four teams will be relegated from Division 2, while the best two of each Division 3 league will be promoted. The number of teams moving between Divisions 3 and 4 will be determined by the total number of teams in 2023. At least one team will be relegated from each Division 3 league.

B teams must be in a division below their A teams (unless both are in Division 4), so if an A team is relegated from Division 1 to Division 2, then the B team will be relegated from Division 2 to Division 3, no matter its place in the table.

Wednesday, February 17, 2021

US Combined Soccer Leagues 2021

UPDATED February 1, 2022: Final standings.

Just suppose that many years ago, the US Soccer Federation required all professional teams to play in the same league system. Just suppose that they decided to divide teams vertically into Division 1, Division 2, etc. Just suppose that, each year, they promoted the best teams from Division 2 and relegated the worst teams from Division 1.

And here's the big leap. Just suppose that we didn't have any more teams playing than what we actually have.

In 2021, the USSF has 79 professional men's teams. After the 2020 season, Reno 1868, Saint Louis, Portland Timbers 2, Orlando City B, and Philadelphia Union II folded. New teams added to Division 3 East are Maryland Bobcats and New Amsterdam, while Austin FC is added to Division 3 West.

Here is a map of the teams. Click the rectangle tab thing in the upper left to get to the list where you can deselect the separate divisions.

Here are the final standings:

Since a wonderful home-and-away round robin doesn't actually happen in each league above, I substitute that with ranking the teams by points-per-game, including each team's league and cup games played in 2021, only counting games against teams in its division (Division 1, 2 or 3).

Four teams will be relegated from Division 1, while the best two of each Division 2 league will be promoted.

Due to the large number of new teams added in 2022, a Division 4 will be added. In conjunction with this, Division 2 will reduce to one league. One team will be promoted from each Division 3 league.

B teams must be in a division below their A teams (unless both are in Division 3), so if an A team is relegated from Division 1 to Division 2, then the B team will be relegated from Division 2 to Division 3, no matter its place in the table. Fort Lauderdale is Inter Miami's B team, so Fort Lauderdale will be relegated if Inter Miami isn't promoted.

Thursday, January 16, 2020

US Combined Soccer Leagues 2020

UPDATED February 2, 2021: Final Standings edited for who's playing in 2021.

Just suppose that many years ago, the US Soccer Federation required all professional teams to play in the same league system. Just suppose that they decided to divide teams vertically into Division 1, Division 2, etc. Just suppose that, each year, they promoted the best teams from Division 2 and relegated the worst teams from Division 1.

And here's the big leap. Just suppose that we didn't have any more teams playing than what we actually have.

In 2020, the USSF has 81 professional men's teams. After the 2019 season, Fresno and Lansing United folded, while the Ottawa Fury moved to Miami to become The Miami FC. Since there are now too many teams for two divisions with two leagues each, a Division 3 was created. New teams added to Division 3 West are 1904, California United Strikers, Los Angeles Force, Oakland Roots, San Diego Loyal and Union Omaha. New teams in Division 3 east are Chattanooga FC, Detroit City, Inter Miami and their B team Fort Lauderdale, Michigan Stars, New England Revolution II and Stumptown Athletic.

Here is a map of the teams. Click the rectangle tab thing in the upper left to get to the list where you can deselect the separate divisions.

Here are the final standings:

Since a wonderful home-and-away round robin doesn't actually happen in each league above, I substitute that with ranking the teams by points-per-game, including each team's league and cup games played in 2020, only counting games against teams in its division (Division 1, 2 or 3).

Four teams will be relegated from Division 1, while the best two of each Division 2 league will be promoted. Three teams will be relegated from each Division 2 league and three promoted from each Division 3 league. If there are more new teams for next year, this may be adjusted. At least one team from each Division 2 league will be relegated no matter how many teams are added next year.

B teams must be in a division below their A teams (unless both are in Division 3), so if an A team is relegated from Division 1 to Division 2, then the B team will be relegated to Division 3, no matter its place in the table. Fort Lauderdale is Inter Miami's B team, so Inter Miami would be promoted in their place if Fort Lauderdale ended the season in a promotion position.

Friday, August 23, 2019

NFL Empires: 1970

This is a continuation of my "empire" maps (where victors take the territory of the losers) of the NFL. Different than most such imperialism sports maps, instead of gaining all the loser's land from a victory home or away, the victor only gets territory for an away victory, and just two-thirds of it (or one-third for an away tie).

1970 was the first season after the NFL-AFL merger was completed. Pittsburgh, Baltimore, and Cleveland moved to the AFC and the rest is history.

Since the Super Bowl was played at a neutral site, the winner gains one third of the territory of the loser (splitting the difference between a home game and an away game).

My data was from Pro Football Reference and most of the logos from SportsLogos.net.

Here then is the map of the NFL empires after the 1970 season:

Baltimore (royal blue) beat Dallas (gray green) in the Super Bowl, which is how Baltimore gained most of their land on this map. They had a great season (and thus home-field advantage during the playoffs) but they didn't beat any big empires till Dallas. In the NFC, Minnesota (dark violet) had home-field advantage, but they lost to San Francisco (burgundy), who then lost at home to Dallas in the conference championship. Thus no empire dominates the map.

Los Angeles (red), Kansas City (light violet), St. Louis (magenta), and New York (dark blue) all had respectable empires (by this year's standards), but all missed the playoffs by a game or two. Kansas City lost at home to Dallas, plus two home ties, to see their empire crumble. Detroit (gray purple) made the playoffs as a wildcard, but promptly lost in Dallas.

Here is the map before the season started:

So much for purple.

Tuesday, August 20, 2019

NFL Empires: 1969

This is a continuation of my "empire" maps (where victors take the territory of the losers) of the NFL. Different than most such imperialism sports maps, instead of gaining all the loser's land from a victory home or away, the victor only gets territory for an away victory, and just two-thirds of it (or one-third for an away tie).

There were no changes to the teams before the seasons.

Since the Super Bowl was played at a neutral site, the winner gains one third of the territory of the loser (splitting the difference between a home game and an away game).

My data was from Pro Football Reference and most of the logos from SportsLogos.net.

Here then is the map of the NFL empires after the 1969 season:

Purple power! Kansas City (light violet) of the AFL beat Minnesota (dark violet) in the Super Bowl, thus expanding their already-large empire. Kansas City had been second place in the AFL West, behind Oakland (light green yellow), but Kansas City beat the New York Jets (dark turquoise) then Oakland in the playoffs, in each of their home stadiums.

In the NFL, Minnesota took all their land during the regular season, then had home-field advantage in the playoffs. Baltimore (royal blue) still had a large remnant of the empire they began the year with, but they only came in second place in the Coastal Division, behind Los Angeles (red). Cleveland (brown) also lost land this year, despite a road playoff victory over Dallas (gray green). To round out the purple on the map, Detroit (gray purple) came in second in the Central, behind Minnesota, and thus weren't in the playoffs.

Here is the map before the season started:

Quite the difference, eh?

Saturday, August 17, 2019

NFL Empires: 1968

This is a continuation of my "empire" maps (where victors take the territory of the losers) of the NFL. Different than most such imperialism sports maps, instead of gaining all the loser's land from a victory home or away, the victor only gets territory for an away victory, and just two-thirds of it (or one-third for an away tie).

Before the season, Cincinnati was added. I've given them the land within a 100-mile radius to start.

Since the Super Bowl was played at a neutral site, the winner gains one third of the territory of the loser (splitting the difference between a home game and an away game).

My data was from Pro Football Reference and most of the logos from SportsLogos.net.

Here then is the map of the NFL empires after the 1968 season:

The New York Jets (dark turquoise) beat Baltimore (royal blue) in the Super Bowl, the first AFL victory over the NFL. The Jets thus were the first AFL team with a large empire on this map, including four capitals besides their own. Baltimore were undefeated at home, with plenty of road wins to amass a huge empire, even after losing a third of it to the Jets. Oakland (light green yellow) won the AFL West, but still didn't have much land to show for it.

Cleveland (brown) won the Century Division and amassed a significant chunk of land, despite losing the NFL Championship Game at home to Baltimore. Green Bay (kelly green) came in third place in the four-team Central Division, but are prominent on the map thanks to a last-week victory at Chicago (periwinkle).

Here is the map before the season started:

Hot map; cool map.

Wednesday, August 14, 2019

NFL Empires: 1967

This is a continuation of my "empire" maps (where victors take the territory of the losers) of the NFL. Different than most such imperialism sports maps, instead of gaining all the loser's land from a victory home or away, the victor only gets territory for an away victory, and just two-thirds of it (or one-third for an away tie).

Before the season, New Orleans was added. I've given them the land within a 100-mile radius to start.

Since the AFL-NFL World Championship Game was played at a neutral site, the winner gains one third of the territory of the loser (splitting the difference between a home game and an away game).

My data was from Pro Football Reference and most of the logos from SportsLogos.net.

Here then is the map of the NFL empires after the 1967 season:

Green Bay (kelly green) had a bad season, including a loss to Pittsburgh (yellow) the final week of the season, but they still won the AFL-NFL World Championship Game. Pittsburgh was last place in the Century Division. Los Angeles (red) and Baltimore (royal blue) were first and second in the Coastal Division, both with large empires. Dallas (gray green) and Cleveland (brown) won their divisions, but neither amassed much of an empire.

In the AFL, Oakland (light green yellow) beat Houston (dark green yellow) in the championship game for the right to lose to Green Bay. Despite that final loss, Oakland still managed to have the largest empire of the AFL teams.

Here is the map before the season started:

New Orleans did all right for an expansion team, eh?

Friday, August 02, 2019

NFL Empires: 1966

This is a continuation of my "empire" maps (where victors take the territory of the losers) of the NFL. Different than most such imperialism sports maps, instead of gaining all the loser's land from a victory home or away, the victor only gets territory for an away victory, and just two-thirds of it (or one-third for an away tie).

In 1966, the NFL officially merged with the AFL. The two leagues kept their names and independent schedules, but met at the end of the season in the AFL-NFL World Championship Game, later dubbed the Super Bowl. Thus Oakland, San Diego, Denver, Kansas City, Houston, Miami, Buffalo, the New York Jets, and Boston entered the league. Also joining the league, but on the NFL side, was Atlanta. As new teams in the greater NFL, all the teams were given the land within 100 miles of their capitals, except for land controlled by a nearer capital.

Since the AFL-NFL World Championship Game was played at a neutral site, the winner gains one third of the territory of the loser (splitting the difference between a home game and an away game).

My data was from Pro Football Reference and most of the logos from SportsLogos.net and Sports Ecyclopedia.

Here then is the map of the NFL empires after the 1966 season:

Green Bay (kelly green) beat Kansas City (light violet) in the AFL-NFL World Championship Game. Since the AFL didn't have much land to start with, Green Bay only gained minimal land from the game, around Kansas City and Houston. In the preceding NFL championship game, Green Bay beat Dallas (gray green) in Dallas, but not much land changed hands that game either. Dallas had lost to Eastern fifth-place Washington (gold) in the next-to-last game of the season, and Washington lost to third-place Philadelphia (dark green) in the last week, so the land Dallas had amassed during the season got divvied up by the end. In the AFL championship game, Kansas City beat Buffalo (denim blue) in Buffalo, which is where Green Bay's new Houston lands came from.

Meanwhile, NFL Western second-place Baltimore (royal blue) expanded their empire nicely, although Eastern second-place Cleveland (brown) didn't. Surprisingly, Western last-place Minnesota (dark violet) managed to hold onto a decent empire, thanks to a mid-season victory at Green Bay and a late win at Detroit (gray purple).

Here is the map before the season started:

100 miles doesn't go very far in southern California, does it?

Tuesday, July 30, 2019

NFL Empires: 1965

This is a continuation of my "empire" maps (where victors take the territory of the losers) of the NFL. Different than most such imperialism sports maps, instead of gaining all the loser's land from a victory home or away, the victor only gets territory for an away victory, and just two-thirds of it (or one-third for an away tie).

There were no changes to the teams from the previous season.

My data was from Pro Football Reference and most of the logos from SportsLogos.net and Sports Ecyclopedia.

Here then is the map of the NFL empires after the 1965 season:

The big three on the map (Green Bay (kelly green), San Francisco (burgundy) and Minnesota (violet), came in first, fourth and fifth place, respectively, in the Western Conference. Green Bay beat Baltimore (medium blue) in a playoff game, then Cleveland (brown) in the championship game, but both were played in Green Bay so no land was won. Baltimore ended their season with home losses to Green Bay and Chicago (light blue), so they managed to shrink their empire despite their place in the standings. In the East, Dallas (gray green) and New York (dark blue) tied for second place, but both only managed minimal gains.

Here is the map before the season started:

Goodbye, Detroit. Goodbye, St. Louis!

Saturday, July 27, 2019

NFL Empires: 1964

This is a continuation of my "empire" maps (where victors take the territory of the losers) of the NFL. Different than most such imperialism sports maps, instead of gaining all the loser's land from a victory home or away, the victor only gets territory for an away victory, and just two-thirds of it (or one-third for an away tie).

There were no changes to the teams from the previous season.

My data was from Pro Football Reference and most of the logos from SportsLogos.net and Sports Ecyclopedia.

Here then is the map of the NFL empires after the 1964 season:

Despite a fourth-place finish, Detroit (gray purple) made a great empire from beating Baltimore (medium blue) in the next-to-last game of the season. Baltimore only lost twice all season, earning first place in the West and managing to keep a sizable yet scattered empire. Cleveland (brown) was first in the East, and they beat Baltimore in the championship game, played in Cleveland. Cleveland didn't get much of an empire, though, due to an early home draw with second-place St. Louis (magenta) and a home loss to sixth-place Pittsburgh (yellow), coupled with failing to beat big landholders in away games. In the Western Conference, Green Bay (kelly green) and Minnesota (violet) tied for second, both with decent empires.

Here is the map before the season started:

Oh look. San Francisco lost their capital.

Wednesday, July 24, 2019

NFL Empires: 1963

This is a continuation of my "empire" maps (where victors take the territory of the losers) of the NFL. Different than most such imperialism sports maps, instead of gaining all the loser's land from a victory home or away, the victor only gets territory for an away victory, and just two-thirds of it (or one-third for an away tie).

There were no changes to the teams from the previous season.

My data was from Pro Football Reference and most of the logos from SportsLogos.net and Sports Ecyclopedia.

Here then is the map of the NFL empires after the 1963 season:

Chicago (light blue) beat New York (dark blue) for the championship, but the game was in Chicago, so they gained no land. Green Bay (kelly green) saw their empire shrink drastically this year, despite coming in second in the West. They started the season with a loss to Chicago and never recovered. Minnesota (violet) controlled a large empire for the first time (despite a losing record), thanks to a late-season draw at Chicago and victory at Philadelphia (dark green). By Eastern Conference standards, Cleveland (brown) had a large empire, as they came in second place in the East.

Here is the map before the season started:

Oh yeah. Detroit nearly disappeared, too.

Sunday, July 21, 2019

NFL Empires: 1962

This is a continuation of my "empire" maps (where victors take the territory of the losers) of the NFL. Different than most such imperialism sports maps, instead of gaining all the loser's land from a victory home or away, the victor only gets territory for an away victory, and just two-thirds of it (or one-third for an away tie).

There were no changes to the teams from the previous season.

My data was from Pro Football Reference and most of the logos from SportsLogos.net and Sports Ecyclopedia.

Here then is the map of the NFL empires after the 1962 season:

Green Bay (kelly green) won the championship game over New York (dark blue), played in New York, so they expanded their massive empire. Green Bay was undefeated at home -- as was Detroit (gray purple), who came in second in the West, hence their large swath of land. Pittsburgh (yellow) earned second in the East, with a good empire by Eastern Conference standards.

Here is the map before the season started:

Remember Baltimore?

Thursday, July 18, 2019

NFL Empires: 1961

This is a continuation of my "empire" maps (where victors take the territory of the losers) of the NFL. Different than most such imperialism sports maps, instead of gaining all the loser's land from a victory home or away, the victor only gets territory for an away victory, and just two-thirds of it (or one-third for an away tie).

Before the season, Minnesota joined the league. They gained the land within a 100-mile radius of their new capital. Dallas were moved from the Western Conference to the East, where they've been ever since.

My data was from Pro Football Reference and most of the logos from SportsLogos.net and Sports Ecyclopedia.

Here then is the map of the NFL empires after the 1961 season:

Green Bay (kelly green) beat New York (dark blue) for the championship, but the game was in Green Bay, so no land was won. Baltimore (medium blue) gained control of a decent empire, despite a mediocre third place in the West. Detroit (gray purple) and Philadelphia (dark green) earned second place in each conference, but neither were consistent at home, so they couldn't accumulate much land. Overall, this season had a high degree of parity, with lower teams beating higher teams and pairs of teams beating each other in the other's home stadium.

Here is the map before the season started:

Lots of land swapping going on...

Monday, July 15, 2019

NFL Empires: 1960

This is a continuation of my "empire" maps (where victors take the territory of the losers) of the NFL. Different than most such imperialism sports maps, instead of gaining all the loser's land from a victory home or away, the victor only gets territory for an away victory, and just two-thirds of it (or one-third for an away tie).

Before the season, the Chicago Cardinals relocated to St. Louis. Also, Dallas joined the league. Both teams gained the land within a 100-mile radius of their new capitals.

My data was from Pro Football Reference and most of the logos from SportsLogos.net and Sports Ecyclopedia.

Here then is the map of the NFL empires after the 1960 season:

Philadelphia (dark green) beat Green Bay (kelly green) in the championship game, but it was a home win, so they gained no land. Detroit (purple) and San Francisco (burgundy) tied for second in the West, while Cleveland (brown) was second place in the East, all with respectable empires. Dallas (sage green) managed to have some land at the end of the year (impressive for an expansion team) thanks to a draw at New York (dark blue) in their next-to-last game.

Here is the map before the season started:

Baltimore and St. Louis were the only teams that managed to hold onto the land around their capitals. That should give them solace after coming in fourth.

Friday, July 12, 2019

NFL Empires: 1959

This is a continuation of my "empire" maps (where victors take the territory of the losers) of the NFL. Different than most such imperialism sports maps, instead of gaining all the loser's land from a victory home or away, the victor only gets territory for an away victory, and just two-thirds of it (or one-third for an away tie).

There were no changes to teams from the 1958 season.

My data was from Pro Football Reference and most of the logos from SportsLogos.net and Sports Ecyclopedia.

Here then is the map of the NFL empires after the 1959 season:

Baltimore (medium blue) beat New York (dark blue) in the championship game, but it was played in Baltimore, so no land was won. Baltimore lost land this year, despite the championship, by losing at home to the Chicago Bears (light blue) and then Cleveland (brown) (both were second place in their divisions). Baltimore then beat the Bears in Chicago, but it was already after the Bears had lost at home to last-place Los Angeles (red). Pittsburgh (yellow) managed a large empire despite a mediocre record, thanks to key road victories in the second half of the season over Cleveland and New York.

Here is the map before the season started:

It's getting harder and harder to hold an empire for multiple seasons.

Tuesday, July 09, 2019

NFL Empires: 1958

This is a continuation of my "empire" maps (where victors take the territory of the losers) of the NFL. Different than most such imperialism sports maps, instead of gaining all the loser's land from a victory home or away, the victor only gets territory for an away victory, and just two-thirds of it (or one-third for an away tie).

There were no changes to teams from the 1957 season.

My data was from Pro Football Reference and most of the logos from SportsLogos.net and Sports Ecyclopedia.

Here then is the map of the NFL empires after the 1958 season:

In "The Greatest Game Ever Played", Baltimore (medium blue) beat New York (dark blue) at Yankee stadium for the championship. It was the first sudden death overtime NFL playoff game. The Chicago Bears (light blue) had a good imperial resurgence this year, coming in second in the West. Los Angeles (red) came in third in the West. All told, the Western Conference controlled about 90% of the land by the end of the season. Eastern second place Cleveland (brown) had barely more than Western fifth place Detroit (purple).

Here is the map before the season started:

'Twas the year of blue.

Saturday, July 06, 2019

NFL Empires: 1957

This is a continuation of my "empire" maps (where victors take the territory of the losers) of the NFL. Different than most such imperialism sports maps, instead of gaining all the loser's land from a victory home or away, the victor only gets territory for an away victory, and just two-thirds of it (or one-third for an away tie).

There were no changes to teams from the 1956 season.

My data was from Pro Football Reference and most of the logos from SportsLogos.net and Sports Ecyclopedia.

Here then is the map of the NFL empires after the 1957 season:

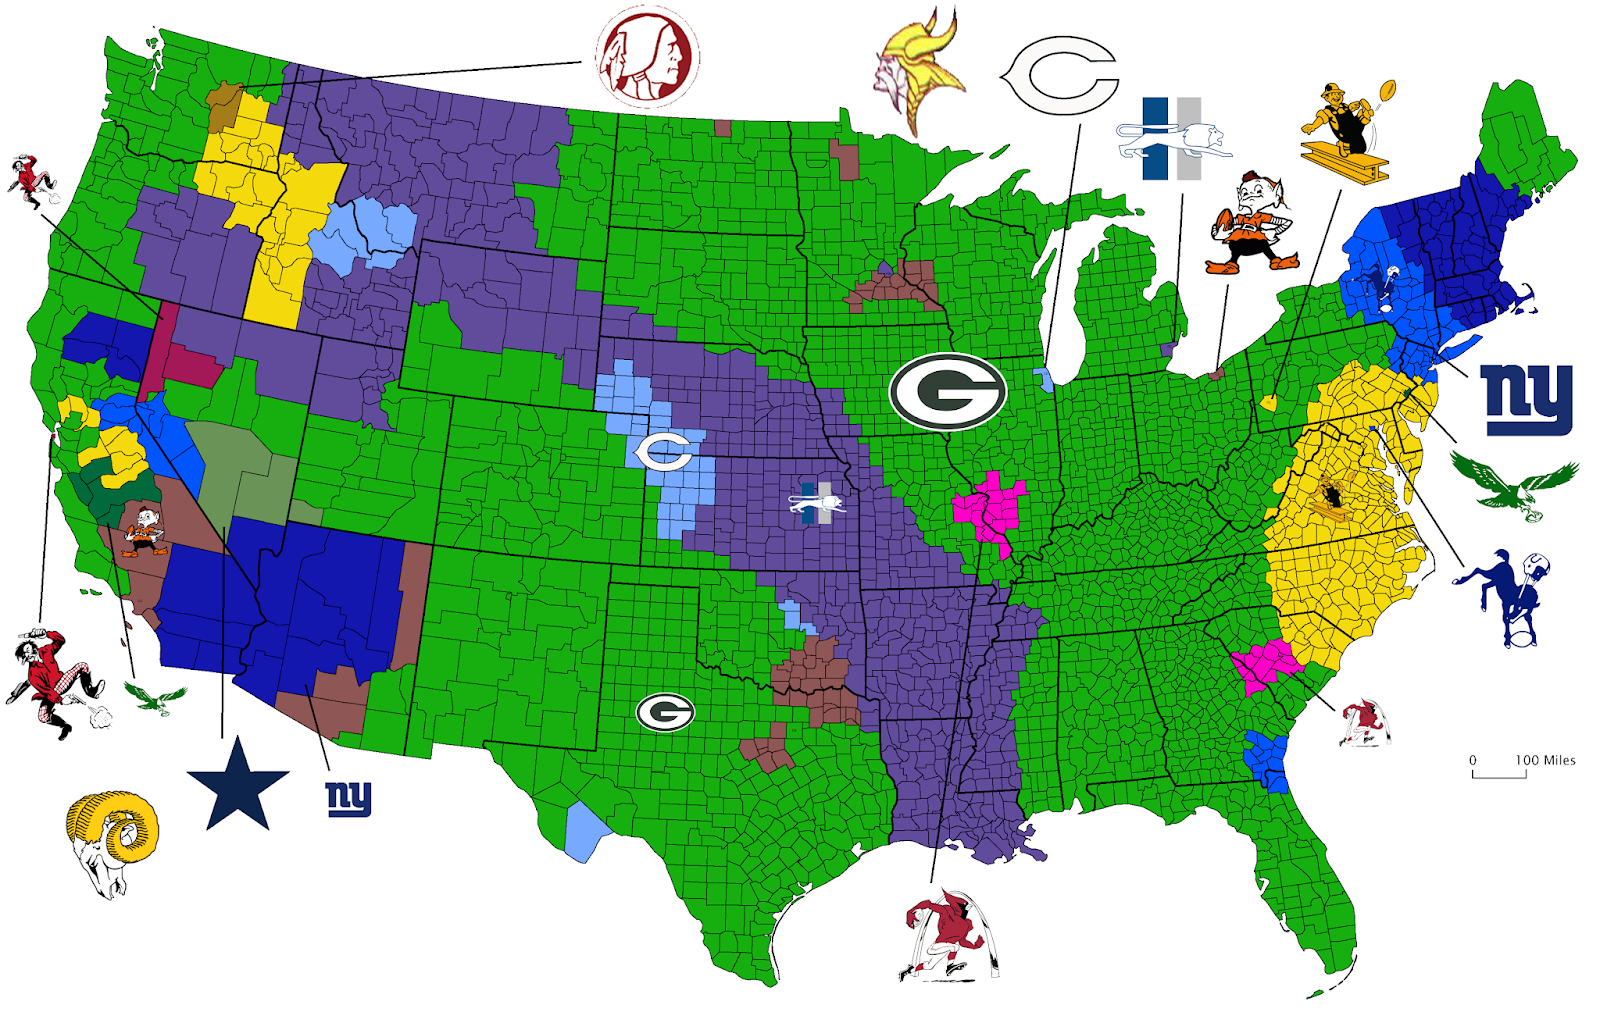
Detroit (purple) won the championship game over Cleveland (brown), but it was played in Detroit so no land was gained. In the Western Conference, Detroit and San Francisco (burgundy) tied for first, so they had a playoff game. It was played in San Francisco, so Detroit actually gained most of their land in that one game. Also prominent on the map is Baltimore (medium blue), who came in third in the West. Washington (gold) gained a good empire even though they had a losing record, fourth in the East, because they beat the Chicago Bears (light blue) in Chicago to get a piece of that crumbling empire. Second in the East was New York (dark blue), who lost most of their empire with a couple late home losses.

Here is the map before the season started:

Bad year for the Bears and that other Chicago team.